Last week I took a look at the Visual Studio Tools for Apache Cordova, which is currently available as a CTP preview. To be honest I didn’t have high hopes, given some disastrous presentations I’d recently seen on this toolset. However, I was pleasantly surprised when I actually took this toolset for a spin – it solves a real problem by providing a unified installer for the necessary SDKs and tools to support Android, Windows Phone and iOS, and provides a very well thought out development platform that builds on top of the already awesome Web tooling that Visual Studio provides. The highlight of these tools is the ability to easily debug Cordova applications using Web developer tools that are integrated directly in Visual Studio, allowing you to debug either the provided emulators and simulators, or debug actual attached live devices including iOS devices.
Cordova
For those of you that don’t know, Apache Cordova – also known as Adobe PhoneGap – provides hybrid  mobile Web development technology that lets you use standard Web technologies to build mobile apps. Cordova works by providing a native device application that hosts a full screen Web browser control as well as tooling for building the app and getting it ready for deployment to a mobile device. As a developer you implement the Web interface using the same Web technologies you use for Web development: HTML5, CSS and JavaScript as well as any support libraries and frameworks you might be using. Cordova – or in this case the Visual Studio Cordova Tools – then can build the application for you into a mobile device specific package that can be deployed to an app store and run on a mobile device. Because HTML5 mobile APIs are severely lacking in consistency and browser support, Cordova also provides a JavaScript based plug-in API that allows it to interact with native hardware and device APIs so you get access to native features of most mobile devices using a common multi-platform compatible interface. There are over 600 plug-ins that interfaces that provide access to most mobile device features and you can build your own plug-ins against native APIs if necessary.
Why do you need Visual Studio Integration?
Cordova on its own does a pretty good job of letting you create projects and build them using command line tools. However, it’s your responsibility to collect all the SDKs and tools you need for each platform and set them up. On Windows you also can’t build an iOS app, which is supported only on Macs. Cordova on its own also doesn’t do anything for debugging your applications – it lets you build and run them on a device but there’s no debugging support.
The Visual Studio Tools for Apache Cordova provide a consolidated installation for all the necessary SDKs and emulators, as well as an integrated development experience from coding to running and debugging of a Cordova applications, all within the boundaries of Visual Studio. Additionally Cordova natively doesn’t allow for building iOS applications on Windows, but using the Visual Studio tools you can actually develop and debug iOS apps on Windows.
Here are some of the highlights of Visual Studio Tools for Apache Cordova:
- Installation of all necessary SDKs for Windows Phone and Android on Windows
- A remote iOS build and debugging agent that interfaces with XCode’s command line build tools
(a Mac and Apple Developer Account is required to build and debug) - A startup template that sets up a multi-platform project (iOS/Android/Windows Phone)
- Customized platform configuration integration
- A host of Emulators you can run on Windows
- Full DOM and CSS Viewer for live applications both in emulators and on devices
- Full JavaScript Console and Debugger using the Visual Studio debugger UI
iOS support is Excellent
I’ve been particularly impressed by the iOS support, which allows you build, run and debug Cordova apps using Visual Studio and run on a live device attached to a Mac. While you still need to have a Mac somewhere on the network and an Apple Developer account to make this work, it’s still pretty impressive to click Attach in Visual Studio and have your app fire up on an actual live iPhone, and then provide you rich browser developer tools to let you interactively access a DOM and Style inspector, a JavaScript Console and use Visual Studio as a debugger.
Ironically the iOS support currently is better than either the Windows Phone or Android experience. Windows Phone/Windows Universal debugging is not yet supported and Android debugging requires devices running Android 4.4 or later.
I’ve toyed with Cordova in the past off and on, and I’ve always turned away from it because it was just too much of a pain trying to debug on device applications especially for iOS devices. Using these tools for Visual Studio however, it feels very natural to develop, test and debug your application either in a browser, an emulator or on an actual device.
Creating a Cordova Application for iOS
To take these tools for a spin I took a small AlbumViewer sample application and moved it to Cordova. I’m going to use iOS as the example here because iOS has traditionally been the most difficult platform for Windows developers to build mobile apps for and to me this is one of the highlights of the Visual Studio Tools for Apache Cordova. Other platforms are actually easier to set up, but currently there are limitations: Android 4.4 has to be used for live device debugging, and Windows Phone/Universal currently don’t support debugging at all, but the range of support is supposed to be better by the time these tools release.

Let’s get started. I’m using Visual Studio 2013 and the add-in package for the Cordova tools (CTP 3). You can also use the Visual Studio 2015 Preview which includes these tools as part of its installation although the template is available only with TypeScript there.
First step is to create a new project:
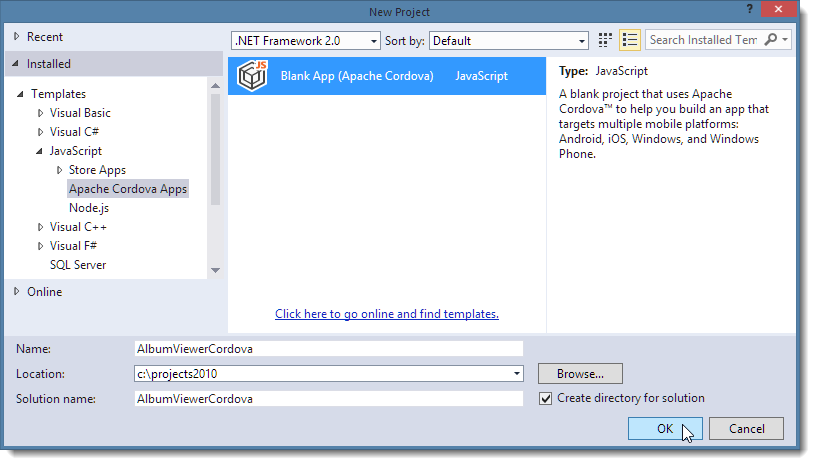
This creates a new project that includes the various platform specific subfolders for various resources, plug-ins and merged components that Cordova internally uses to build a native application.
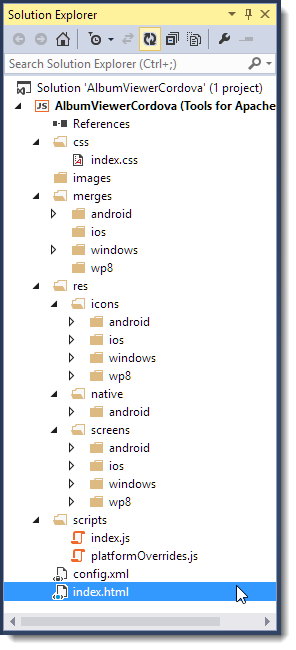
This project contains a bunch of stuff that’s mostly related to the 3 platforms that Visual Studio defaults to: Android, iOS and Windows Phone/Universal.
The key component in this project is the index.html page which is the application’s start page that Cordova launches when the mobile app starts. From there you can essentially launch your Web based application and go to town. The main difference is that the index.html references cordova.js and platformoverrides.js, which are platform specific, generated files that Cordova produces when it packages your app.
cordova.js is the gateway to Cordova’s platform specific integration features. Most importantly it’s the interface that provides the plug-in system which is used to extend raw browser behavior and allows third parties to expose native APIs as JavaScript APIs in your application. Plug-ins are meant to get around the shitty HTML5 mobile API support and provide a consistent platform for accessing hardware like the camera, microphone, haptic feedback, battery status, or access software APIs for things like access to the Camera Roll, the contacts, call list and SMS systems on devices. There are over 600 Cordova plug-ins available to date to allow you to integrate more closely with a device and the API is open so you can build your own extenders into any of the mobile device platforms supported.
The index.html file is the application’s entry point and essentially you are building a Web application. So anything you’d normally do with a Web application – display a start page and have logic in JavaScript files or hooking up a framework like Angular works as you’d expect.
The default index.html looks like this:
<!DOCTYPE html>
<html>
<head>
    <meta charset="utf-8" />
    <title>AlbumViewerCordova</title>

    <!-- AlbumViewerCordova references -->
    <link href="css/index.css" rel="stylesheet" />
</head>
<body>
    <p>Hello, your application is ready!</p>

    <!-- Cordova reference, this is added to your app when it's built. -->
    <script src="cordova.js"></script>
    <script src="scripts/platformOverrides.js"></script>

    <script src="scripts/index.js"></script>
</body>
</html>
Notice the three script links which load the Cordova dependencies.
index.js serves as an entry point that exposes a few key lifetime events for a mobile app:
(function () {
    "use strict";

    document.addEventListener( 'deviceready', onDeviceReady.bind( this ), false );

    function onDeviceReady() {
        // Handle the Cordova pause and resume events
        document.addEventListener( 'pause', onPause.bind( this ), false );
        document.addEventListener( 'resume', onResume.bind( this ), false );

        // TODO: Cordova has been loaded. Perform any initialization that requires Cordova here.
    };

    function onPause() {
        // TODO: This application has been suspended. Save application state here.
    };

    function onResume() {
        // TODO: This application has been reactivated. Restore application state here.
    };
} )();
These are useful *if* you want to take special action when these events occur, but this matters only if you are depending on Cordova specific features in your app.
In the end what you are working with is just an HTML5 application, which means you should be able to use any application and just make it work.
Importing an existing Web App
To test this theory of how well an already running mobile aware Web app would translate to run with Cordova, I took a recent sample application – an AlbumViewer I created for another article – and ported it into Cordova. I’m going to spoil the suspense by telling you up front – it worked, and it worked with only a few modifications.
You can check out this sample app from this GitHub repository:
https://github.com/RickStrahl/CordovaAlbumViewer
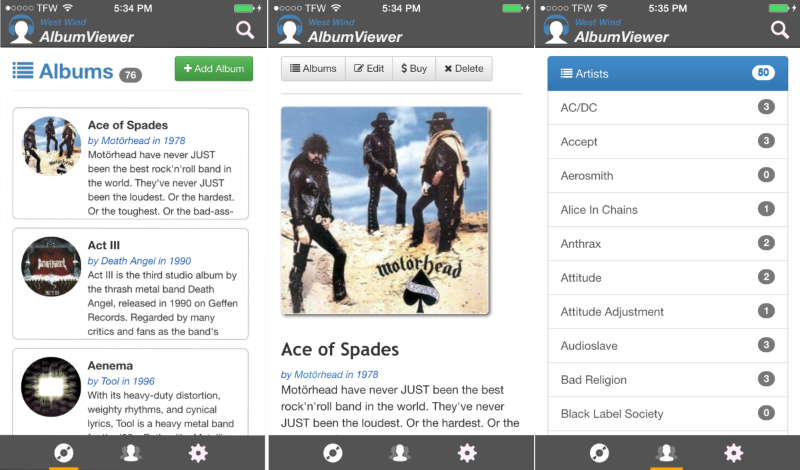
Here’s a screen shot of the app running on an live iPhone.
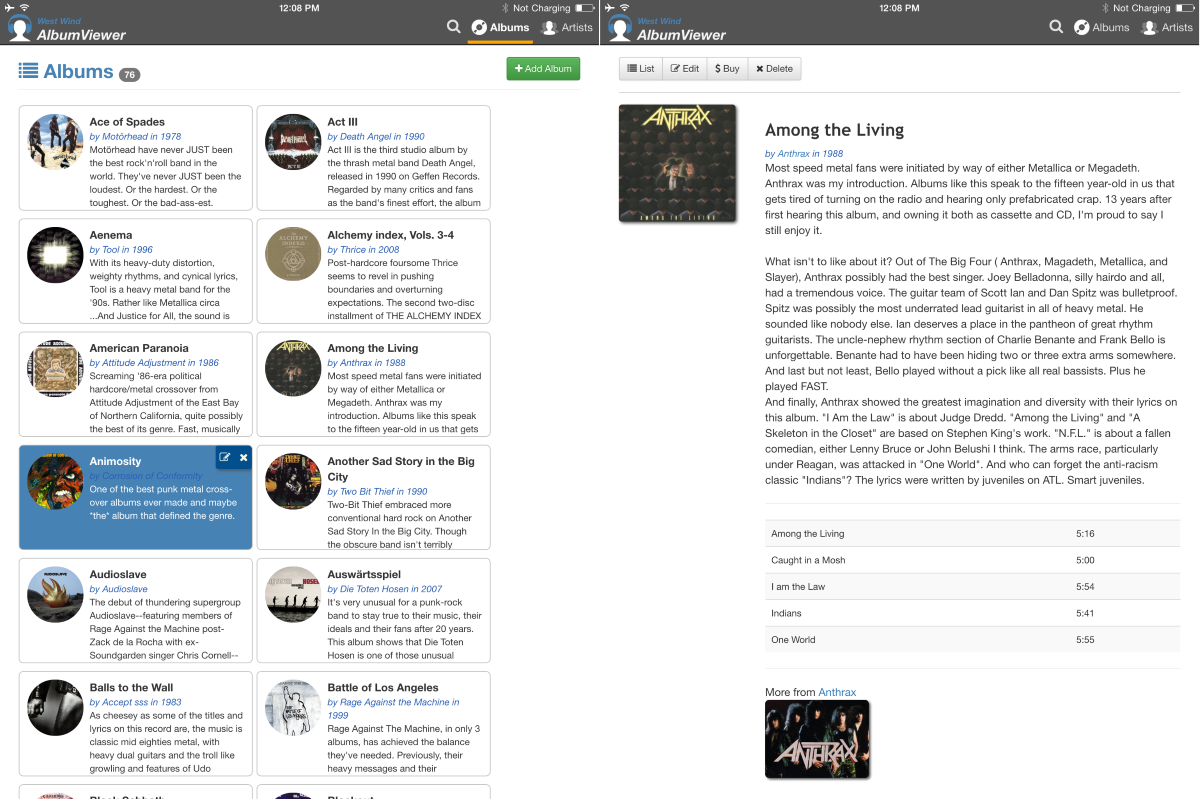
And here’s the same app running on an iPad:
So let’s take a look at the process involved in making this happen.
Remove external Dependencies – Using local Data
At this point I’ve created a new project and am starting from ground zero. This existing app originally worked against a local Web service (which was the main point of the previous article), so the first thing I wanted to do is remove the dependency on the service and switch to local data. The application is an Angular application and it uses services for the data access to the service to retrieve data.
Originally there was an AlbumsService and ArtistService to retrieve data. I ended up creating corresponding AlbumsServiceLocal and ArtistServiceLocal implementations that pulled the same data from local files and then stored them in local storage after that. The idea is that a mobile application should as much as possible use local data and access the Web mainly to sync. In this case I didn’t want to have the sample rely on having to set up a service locally so I kept the data all local.
I made these changes BEFORE I moved the code over to Cordova, because I figured it’d be easier to do in a pure Web environment. Turns out that’s not exactly true – I can actually set up Cordova to run my app the same way, but I didn’t figure that out until later :-) I’ll come back to that later when I talk about process a little.
Importing into the Project
Once I had the app running with local data and without other dependencies I decided to move it into the Cordova project. This is as easy as copying the files into the project wholesale. After I’ve imported the project now looks more like a typical Web project:
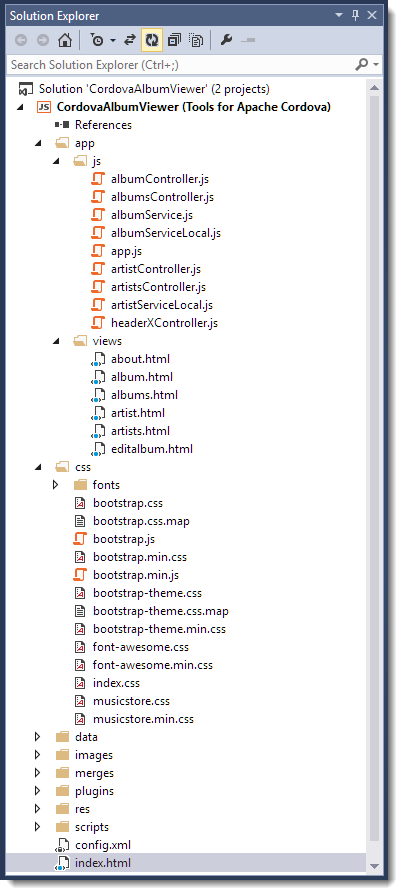
The only file overwritten in this process is index.html which is the main startup page for my application that hosts the Angular ng-app layout and that is responsible for loading up all related script and style resources.
index.html is also the only file I had to initially change after copying – I had to add the three Cordova dependencies:
<script src="cordova.js"></script>
<script src="scripts/platformOverrides.js"></script>
<script src="scripts/index.js"></script>
And that’s all I changed initially.
Testing the App under Cordova
So far this isn’t impressive. All I’ve done is moved a Web project to a new folder. But now lets see how you can actually test out this application. Cordova comes with a host of different emulators and simulators. There are Web based emulators that provide basic functionality and there are the full fledged emulators that the various SDKs provide and of course you can run on an actual device.
For the initial test I’m going to use the Ripple Browser emulator for iOS that allows you to see your app running using Cordova and also gives you a first taste of the debugging experience.
To select an emulator select your target platform in the drop down next to the build target (Debug) list. Since I’m targeting iOS eventually I’ll use that. Then click on the drop down next to the Attach button to pick your emulator. I’ll pick the Ripple iPhone 5 emulator since that’s as close as I can get to my iPhone 6 I want to test with later.
Here’s what those options look like:
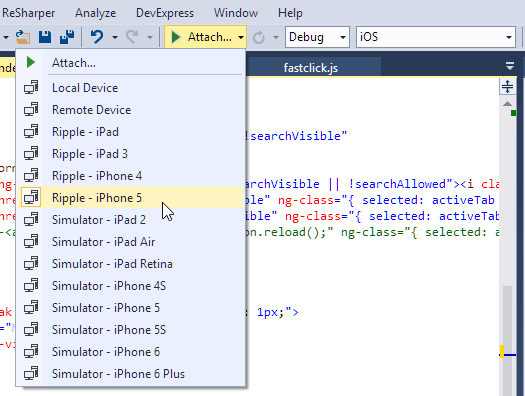
Note that there are options for Remote Device which allows me later to run on my live phone, and various Simulators which are the Mac based iOS simulators from the Apple iOS SDK. You can use either of these only if you have an attached Mac and an Apple developer account. I’ll come back to that shortly. For now I’ll use Ripple.
To start up the app, click Attach… and go.
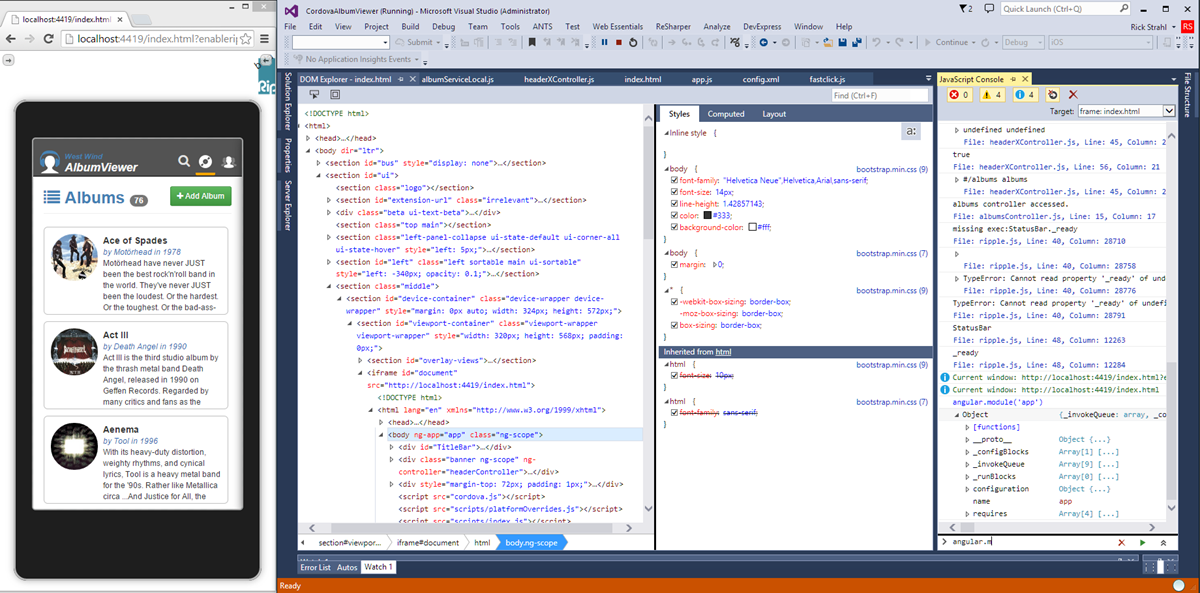
When you run your application, Visual Studio launches the emulator and puts itself into Web DevTools mode. These Dev Tools look like the same Dev Tools that are in the latest versions of Internet Explorer, but note that I’m actually running the Ripple browser which actually runs in Chrome. So in effect I’m using the IE Dev Tools to debug Chrome. That’s… new and it works very well.
You have a live DOM Explorer (you can change things and reflect in the app!) and CSS Style Viewer as well as a full JavaScript console. Any console.log commands from your JavaScript code will show up in the Console as will errors and networks navigations etc. IOW, it behaves as you would expect browser Dev Tools to behave. The Ripple emulator is browser based and because it runs in Chrome you can also use the Chrome’s Dev Tools to debug the application, so you have a choice which browser tools you want to use.
The exciting thing here is that these Visual Studio based Dev Tools also work when you debug a native device as I’ll show in a minute.
So now we can get the app to run in a browser – ho hum. We know how to do that without Cordova. So let’s take a look to run this on a live iOS device.

Setting up for iOS Deployment
To build apps for iOS you’ll need a Mac and an Apple Developer account.
To be clear, I’m pretty green when it comes to using a Mac. Although I have a Mac Mini at home that I use for music recording and the occasional browser testing for Web applications, I generally don’t use the Mac much. When I do it feels like I’m going into a foreign country vacation… in general I’m mostly fumbling around when working on the Mac especially trying to figure out where things go when dealing with terminal related tasks.
However, given the tooling and instructions Microsoft provides, the installation of the remote build agent was straight forward. Although I ran into one snag I was able to get everything running on the Mac in the course of 15 minutes which is better than I’d expected.
Install Mac Applications
The first thing you have to do is install the tooling on the Mac, which involves manual installation of a few applications and some command line tools via Node Package Manager (NPM). The base documentation and links for this can be found here:
To summarize here’s what you need to install to get started. Install the following Mac applications:
You’ll also need:
- An active iOS Developer Program Account
Install the Remote Build Agent
Next you need to install the actual Visual Studio Remote Build Agent. The install instructions are pretty simple. Open a command prompt on the Mac and run:
cd /usr/local
sudo npm install -g vs-mda-remote --user=Username
where Username is your Mac username.
The NPM installer installs HomeBrew (a package manager for the Mac if it isn’t installed already), and the XCode 6 Command Line tools as well as the actual Visual Studio Remote Tools for Cordova Build Agent. Unfortunately, for me these simple instructions did not work – I saw failures trying to install HomeBrew and I had to manually install it (http://brew.sh). Once HomeBrew was installed I re-ran the NPM install for the build agent and was able to get the remainder of the tools installed.
Set up a Linked Developer Account
You also need to make sure that XCode has a linked developer account which you can do by starting XCode and then going the XCode menu | Preferences | Accounts and linking a developer account. Follow the prompts to add your Apple developer account to the list of identities.
Firing up the Remote Build Agent
Once the tools are installed and you have a developer account set up, you can run the the VS Remote Build Agent from the Mac Terminal:
vs-mda-remote --secure false
This starts the build tools and listens for connections on port 3000.
Set up Visual Studio to use the Remote Build Agent
Next you have to configure Visual Studio so it can find the remote build agent on the Mac. You can do this via Tools | Options | Tools for Apache Cordova:
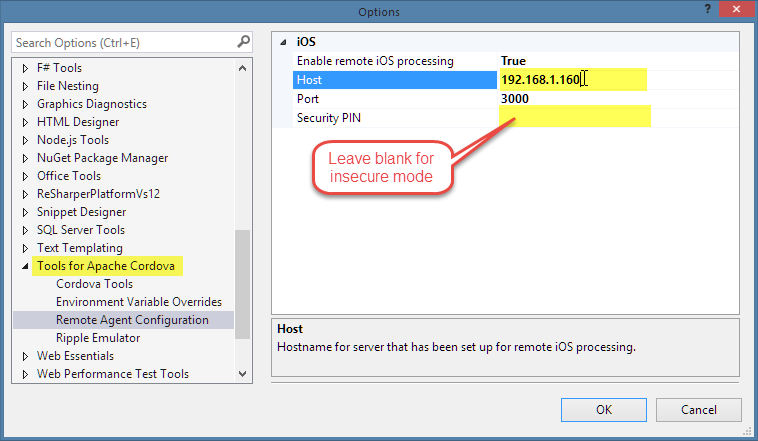
You specify the IP or host name for the Mac remote host, the port which defaults to 3000 and an optional security pin. I prefer to not use a pin and run the remote agent on the Mac with the –secure false flag. Unless network security is an issue for you I would recommend you don’t use a PIN as I found I had to frequently reset the PIN which turned into a real pain. If you do want to use PIN you can run vs-mda-remote generateClientCert to generate a new PIN, which is then displayed in the terminal window.
When done with the config form in Visual Studio click OK. If you don’t get an error the remote agent was found and you’re ready for remote processing on the Mac.
Ready, Set… Run!
Make sure that the build agent is running on the Mac and an iOS device is attached and the screen unlocked anytime you plan on building or running your application on iOS. To run the application, open your Cordova project in Visual Studio and make sure you select iOS as the platform, and Remote Device from the Attach drop down. Then click the actual Attach button to run the app and watch the magic.
When you hit the Attach button, Visual Studio communicates with the remote build agent on the Mac to push over the files to process.
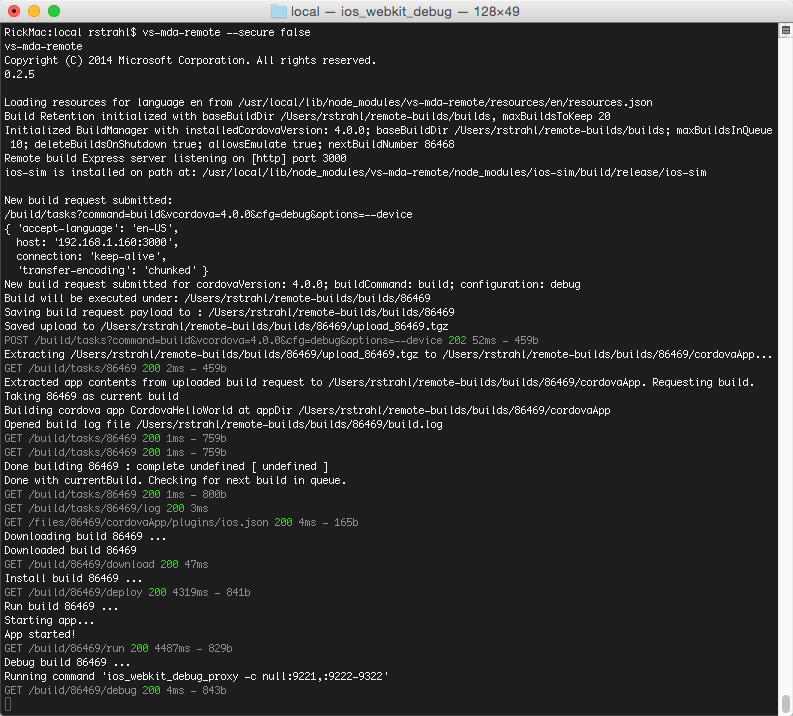
The remote agent basically handles setting up a Cordova project on the Mac and then uses Cordova to compile and run the project on the device (or emulator). Cordova in turn uses the XCode command line tools to build the XCode project that it creates and get it deployed on the device to test.
For the first run this can take a couple of minutes as the project is set up for the first time in a temp folder on the Mac, but subsequent runs take about 15 seconds from hitting Attach to having the app active on my phone. Not bad at all. The app should now be running and behave just like a browser based app on the phone.
When the app comes up on my iPhone, Visual Studio also switches back into the DOM debugger, as shown earlier with the Ripple emulator. Same deal – I can see the DOM, active styles and the JavaScript console. The active document is live so I can make changes in the DOM Explorer and see them immediately reflected back on my iPhone! Likewise I can use the Console to echo back info from my app or actually change any global state.
Debugging an iOS App
If you want to debug, you can easily do that as well. Simply set a breakpoint in any of the source files and run the application. Here’s a breakpoint being hit when loading the list of artists:
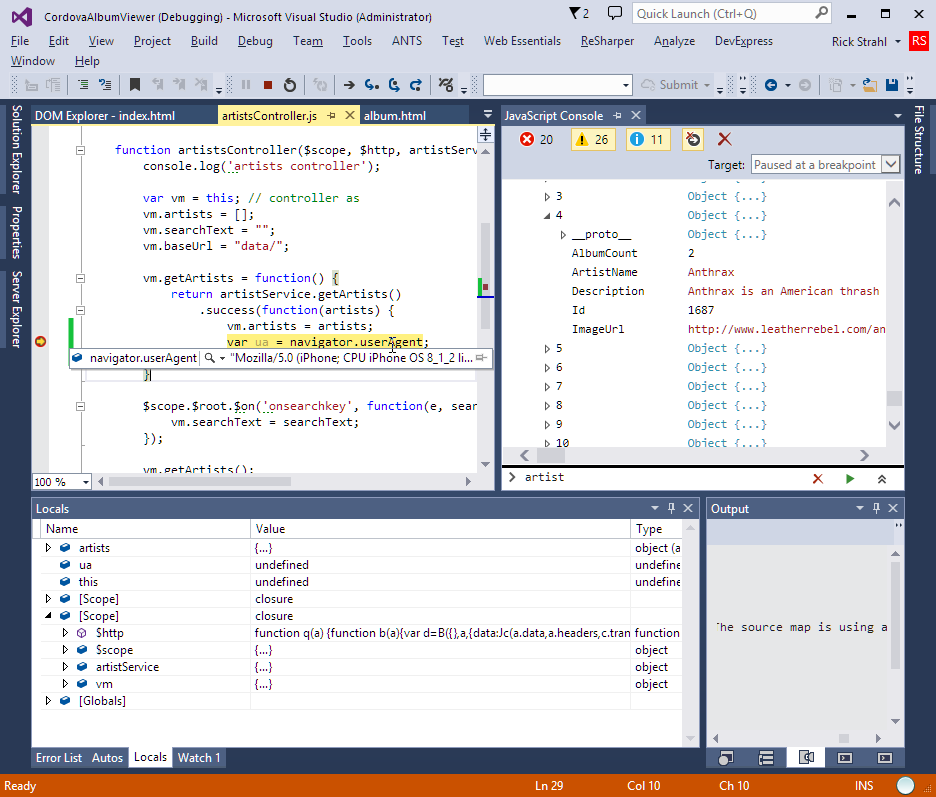
You can see that you get both the inline inspection (notice the dummy user agent code I put in to show it’s coming from the remote iPhone), as well as the Locals and Watch Windows and the Console Window view on the right where you can use use for example console.log(albums) to log out any values that are in scope to inspect – and edit – values in real time.
I don’t know about you, but I find this pretty impressive. Remotely debugging on the actual device is pretty sweet and to me at least has been one of the missing pieces in Cordova development before. Although you could always debug applications using plain browser tools or even the Ripple debugger, debugging actual behavior, styling/layout and the actual Cordova plug-ins in a live debug view is awesome. Big props to Microsoft for making this work and integrating the debugging experience so nicely into Visual Studio.
Debugging Gotcha: Startup Code debugging doesn’t work
Note: there’s a bit of a gotcha when it comes to debugging startup code. The Visual Studio debugger takes some time to get attached and so you can’t debug startup code and even some initial code like the first page loading. In the above example I’m stopping on event code, so that works but had I put code in the initial rendering of artists it wouldn’t have worked. If you do need to debug startup code you have let the page load and then somehow reload the index.html page after the debugger has been attached. You can add a button or link anywhere in the app (I have mine on the Settings page when I’m running in ‘developer mode’) that does: window.location.href='index.html'. This reloads the index.html page when the debugger is already attached and you can then debug any startup code.
Other Platforms
Android
You can get this same debugging experience I just described for iOS from Android (4.4 KitKat and later) devices attached to the local machine and if the devices are switched into developer mode and have USB debugging enabled. Note that older devices are not directly supported although I think if you install the appropriate SDKs and change a few environment variables you can make it work. I didn’t try. According to the docs v4.4 and later works. I tried running my app on a v4.4 Galaxy Tab 4 7” and the app ran without much of a problem – once I had the SDKs set up properly.
The Cordova Tools for Visual Studio install the Android SDK, but I had major issues getting the project to build initially. I found that several components that are required weren’t actually installed. The following link has detailed information that worked once I double checked and installed all the required components that somehow the installer didn’t install:
Once the SDK was properly installed however I was able to step right in and run and debug my application on the Android Device.
Another oddity is that the Web site mentions a new, optimized Android emulator that’s supposed to install with these tools, but on my machine this emulator is nowhere to be found even though I have both Visual Studio 2015 (which also includes the Cordova tools) and the add-in package for VS2013. This seems like it would be a useful thing to have although I think having a live device ultimately is the better choice as it seems and much less resource intensive than actually loading into an emulator. In fact I picked up the Galaxy Pad for just this reason a while back. It’s not a great device (very slow and choppy especially when compared to the iPad), but it’s a good way to test on an ‘average’ Android device.
Windows Phone
Ironically Windows Phone and Windows Universal is the platform that currently has the least integration with these Visual Studio Cordova Tools. In this preview, you can’t debug on a live Windows Phone device or even the emulator. The docs mention that this is just for the current preview. I have a Nokia Lumia 920 and the app
Windows Phone and Angular Routing
Windows Phone required some special configuration to deal with IE mobile’s link fixups. Apparently Windows Phone browser considers hash-bang URLs with multiple segments suspect and marks them as unsecure:ms-appx:#/artist/2. This causes problems for Angular’s navigation and a pop up dialog that tries to download an application to handle this URL moniker.
The workaround for this is to let Angular know how to handle the ms-appx moniker, and essentially ignore the funky prefix and navigate it. You can use the following config override in app.js:
app.config([
'$routeProvider',
'$compileProvider',
function($routeProvider,$compileProvider) {
        // … Route Configuration
        // Fix bug for Windows Phone wanting to download files on urls with routed parameters
        $compileProvider.aHrefSanitizationWhitelist(/^\s*(https?|ftp|file|ms-appx|x-wmapp0):/);
}]);
As usual with anything Microsoft and browser related there are a lots of problems with getting the application to run on Windows Phone. Here are a few of the problems I ran into:
- The ms-appx prefix issue above
- Bootstrap Modal is just MIA – not popping up just blank (not fixed)
- FontAwesome fonts wouldn’t load until I explicitly remove cache busting query string
- A number of buttons (not all though) just take multiple clicks before they navigate
- I ended up turning off CSS transitions but when they were on they were ridiculously slow
Running as a pure Web App in your Browser
As a side note – you can also still run the app as a ‘pure’ browser app because a Cordova app is essentially a Web app plus some Cordova plug-in juju. If your app can run without the Cordova specific features you can debug it in the browser. Since we’re essentially talking about Web applications here that typically have only very minor or no mobile integration that relies on plug-ins I find that I can actually be most productive developing and debugging using simply Chrome and the Chrome DevTools and then only occasionally test on the actual device.
To do this you can start a Web Server in the Cordova root folder and just open the index.html page. I like to use the the NPM installed http-server:
npm install http-server -g
then simply change to the folder of the app and run it:
cd c:\projects\CordovaAlbumViewer
http-server
which starts the server locally on port 8080 (which you can override with a command line switch). You could also use IIS Express started from the command line if you prefer.
When you run this way loading of the cordova.js file will fail (it’s not actually there) so any dependencies on plug-ins won’t work. However, anything else will work just fine inside of the browser.
Summary
These Visual Studio Tools for Apache Cordova are a very nice bit of tooling that’s going to make it much easier to build mobile Web applications and get them deployed into App stores.
Personally I believe that Web technology ultimately will win out over the crazy multi-platform development craze that we’re seeing now. It’s only a matter of time – but it’s just such a shame that W3C and HTML5 standards have let us down so much over the last few years to provide so little native mobile support in terms of mobile API access from Web browsers.
Cordova provides a bridge by combining a plug-in API that makes it possible to build the interfaces to native devices and expose that functionality. Looking at it with a cynical eye I would say that Cordova’s approach is much more useful than the stuck-in-the-mud mobile standards for HTML5. If only the mobile browsers would provide a similar model natively we could actually expect HTML5 evolve into a better mobile platform. But alas in the meantime Cordova provides that bridge to make it at least possible to build single code base mobile applications.
Microsoft’s tooling offers a very useful productivity boost on top of Cordova making the development process and more importantly the debugging process much more natural.
The Visual Studio Tools for Apache Cordova are currently in CTP state with an expected release timed to the release of Visual Studio 2015 later this year. You can install these tools either as a Visual Studio add-in package for Visual Studio 2013 or by downloading the Visual Studio 2015 Preview. Go to http://tinyurl.com/ptgkz6k to download the tools and start building mobile apps.
To find out a bit more about the Visual Studio Tools for Apache Cordova and this sample check out my forthcoming article in CODE Magazine that provides a bit more detail along with some additional discussion of gotchas and tweaks of the application discussed here. It’ll be in the March/April issue.
Resources
Other Posts you might also like