 About a year ago I introduced an easy to use URL and load testing tool called West Wind WebSurge. I created this tool out of a sense of frustration with existing stress testing tools that are either wickedly expensive, or a pain in the butt to use. I wanted an interactive tool that makes it easy to set up and test URLs either individually or under load. What started out as a requirement on a client project, quickly morphed into a custom load testing library and then eventually into a product that combines the load engine with an easy to use UI to make it easy to create the URLs and run the tests.
The end result of this was West Wind WebSurge which is a Windows based application that makes it very easy to enter and capture URLs and then play them back either individually for functionality testing of individual URLs or under heavy load for performing stress testing. WebSurge stores the test information in plain text files that can be shared easily in projects or source code repositories and can be easily generated by tools. The main goal of the front end piece is to make it super quick and easy to capture or create URLs for tests, store and save them so that you can easily create repeatable tests, that you will actually run on a regular basis. Even starting from scratch you should be able to start running tests in a couple of minutes.
So, today I'm happy to announce that I've released version 1.0 of West Wind WebSurge after a lengthy beta period.
You can download and find out more about West Wind WebSurge from these links:
or take a peak at the functionality available in this YouTube walk-through video:
Installing
The easiest way to install West Wind WebSurge is through Chocolatey:
choco install westwindwebsurge
But you can also download the installer directly from the download link and then run the embedded installer exe.
WebSurge and Me
For me personally I've been using WebSurge in just about any Web project I've created in the last year and it's been especially useful in API projects. I use WebSurge for all my API testing to test individual URLs interactively. When building client centric Web applications almost everything becomes an API and since I prefer to design my APIs up front before there is any Application UI to test it, some sort of testing tool is required. WebSurge makes it easy to manually create the request trace and then test it against the server. Yes there are other tools for that like Postman, which is excellent and I've been using it for years. However, there are a number of things that make WebSurge more useful to me. I switch around servers quite a bit and Websurge makes it easy to transform test URLs to work against different domains/virtuals. So I can take a series of URLs created on an IIS Express test url and run it against a staging site just by changing the domain in an options setting. If necessary I can also run a quick search and replace on the actual HTTP trace text files used by WebSurge to modify URLs or headers or whatever else needs to be modified in a set of requests.
Once the URL tests exist the stress testing comes for free - I can just turn on the load testing parameters and I can fire a given number simultaneous connections to load those same URLs. For HTML based sites the capture tool lets me easily capture HTTP content including HTTPS requests and then use that for stress testing. Having the ability to easily create load tests I now routinely set up captured tests of server side applications right when I create them to check for performance issues early on. Because it's so easy to create and recall tests, I test for performance under load on a regular basis now as I build applications…
Anyway for me at least (I'm only slightly biased)WebSurge has become a very useful tool in the Web Development process.
How did I get here?
When I started out on this path, I wasn’t planning on building a tool like this myself – but I got frustrated enough looking at what’s out there to think that I can do better than what’s available for the most common simple load testing scenarios. My goal wasn't to build the end all load testing tool to replace super high end networked solutions. Rather I wanted to build a tool that can create and run local tests quickly and easily so that the job actually gets down. Having a user friendly UI that makes it easy to manage requests and run tests is key to that as well.
WebSurge can handle 10's of thousands of requests a second, but it's not meant to replace massive load generators that create a million requests a second. If you need that much performance, then you're probably a good candidate for those big bucks, high end tools that gave me sticker shock :-) I've tested WebSurge on my i7 MacBook Pro under Bootcamp laptop capturing close to 50,000 reqs/sec against static content, just to give you an approximate measuring stick -so if you're testing apps that have higher request loads than that then WebSurge may not be for you. I suspect not many of you are working with apps that have 10's of thousands of requests a second, and if you are you are likely already using some other load testing solution anyway. For the rest of us who are happy to be dealing with thousands of requests a second, WebSurge works great.
 #
#
West Wind Web Surge – Making Load Testing Quick and Easy
So I ended up creating West Wind WebSurge with the goal to make it drop dead simple to create load tests. It should only take a couple of minutes to fire up WebSurge, add a few URLs and test the URLs either individually or in bulk for a load test. Let's take a look and see what this looks like.
WebSurge works with Sessions of Urls. You create URLS either by manually entering them or by using the built in capture tool. While using WebSurge the most common view you'll see is the session view and here's what it looks like:
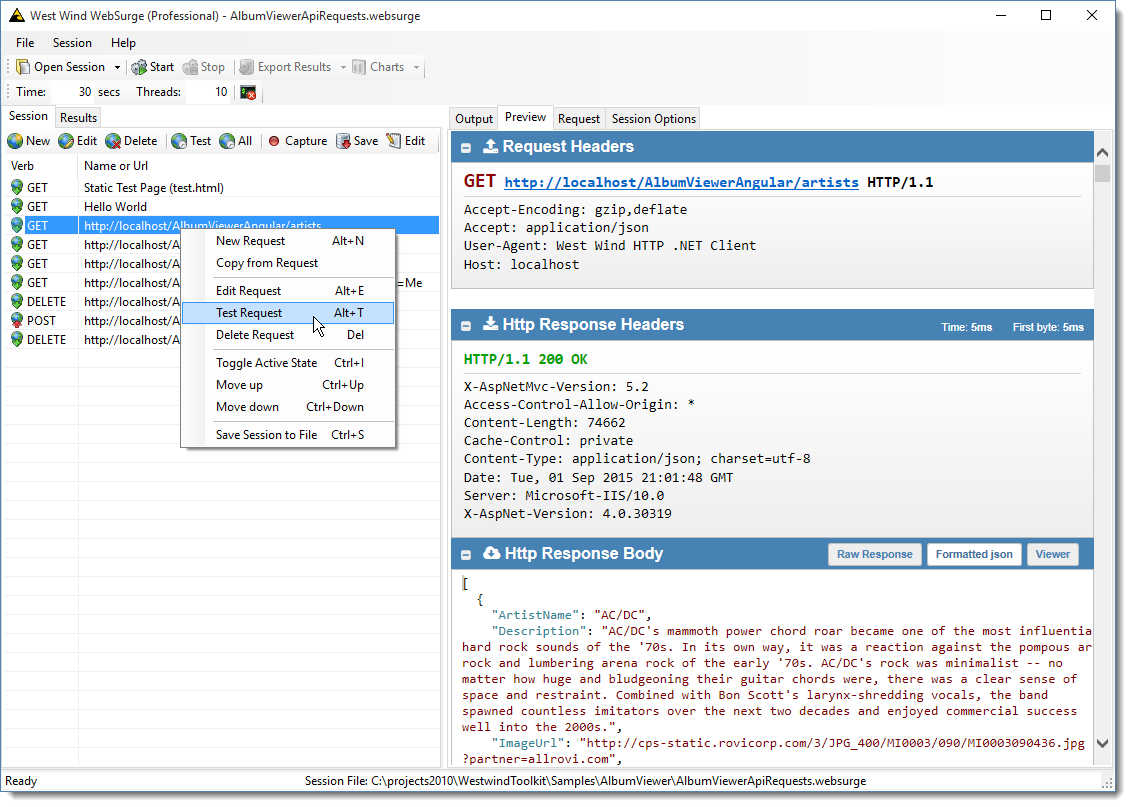
A session is a collection of URLs that runs when you run a load test.
When you click on a request the request info is automatically shown in the detail pane on the left where you can see the request trace.
But you can also test URLs individually and just one request at at time while poking around the user interface. You can right click for a host of options on a single request:
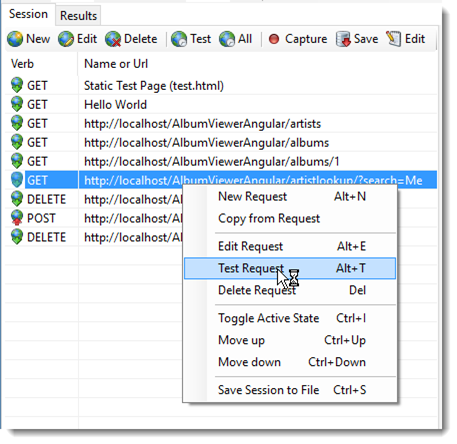
The Test button lets you run an individual request or Test All will run all requests that are active exactly once and show you the results pane with a list of each of the request. You can also make URLs inactive (Ctrl-i), so they are excluded from load tests and Test All, which is useful to hide certain requests from tests temporarily. For example, I occasionally have maintenance links I need to test individually, but not as part of a test run. I can just disable that request which excludes it from any test run, but lets me still test it individually. You can also make all but one request inactive if you want to load test a single request out of a session which is a common use case for me while I'm working on a particular request and trying to tune performance or find problem related to high load.
When running tests, WebSurge by default runs the URLs in the sequence shown in the session list. When loading up requests it runs each request in a session in serial, but runs many sessions simultaneously. This is useful in scenarios where you have dependencies on the order in which things happen for a given user and you can rearrange the order interactively.
WebSurge remembers the last Session that was open and automatically opens that session for you when you restart so you're typically ready to go. You can also load session that were previously saved to disk and restore sessions from there. Because these are simple text files these files are easy to save to disk and share and I typically store my WebSurge session files in application solution folders and check them in with source control so they are available to anybody working on the project. Sessions can also easily be shared on Dropbox or OneDrive. The text files files have a .websurge extension that is associated with WebSurge, so double clicking on the file opens the session in the WebSurge UI.
Creating Sessions of URLs
Before you can actually do any testing you need to capture the URLs and there are two ways to do this: Manually or using the Capture tool.
The most obvious way to create new requests is to use the request editor by pressing the New button in the Session window. Requests are simply a URL, an HTTP verb, headers and content and if you manually enter the content or edit it here's what it looks like:
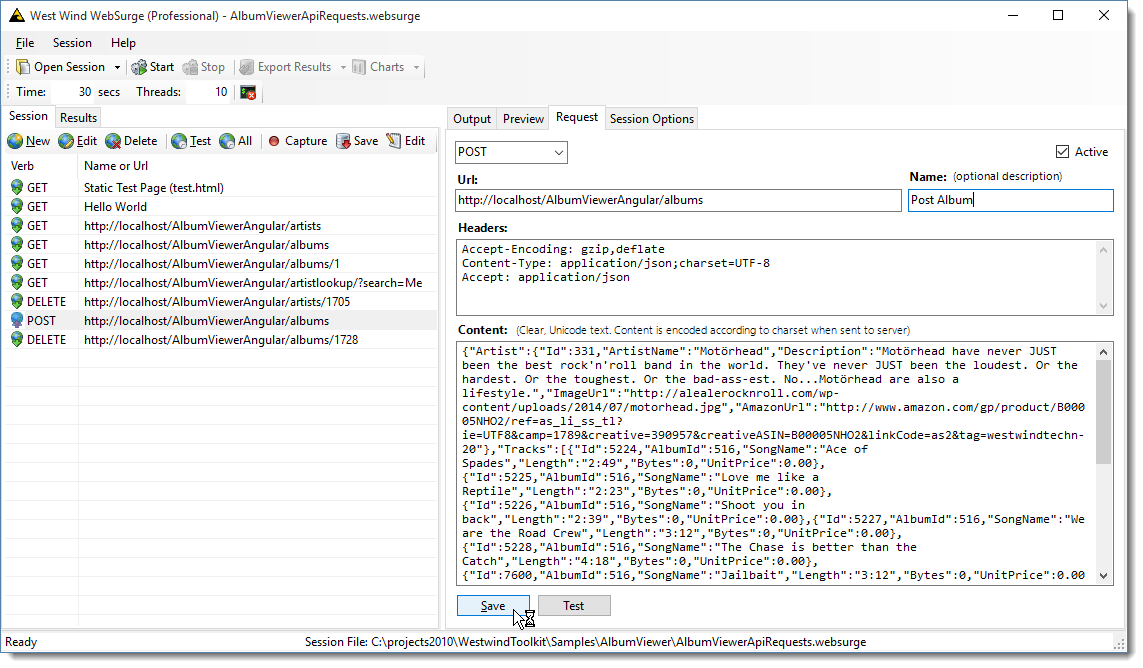
If you add POST content, it's added as plain text and the request handler automatically adds the proper encoding. You can also capture and add binary data which is stored in base64 format and then converted back to binary when the data is sent out. Requests can also be named. If you are doing API testing you often end up with long very similar URLs, and being able to give descriptive names to requests can be easier to read. The POST editor pops up by double-clicking the window and the header and content panes are resizable.
Manual entering works great if you are working on an application and creating requests as you go. I personally tend to create my URL request here first, then create API endpoints to handle each request in typical test first style.
Capturing Session Data
If you have an existing, running application you want to test, then using the capture tool makes life easier as you don't have to manually create the requests, can just capture them from the running application.
You can also capture output from Web Browsers, Windows Desktop applications or service applications. Basically any HTTP source that goes through the Windows HTTP stack (either Windows or .NET APIs) can be captured. In the following screen shot I'm simply capturing the API output from the running sample application on localhost:
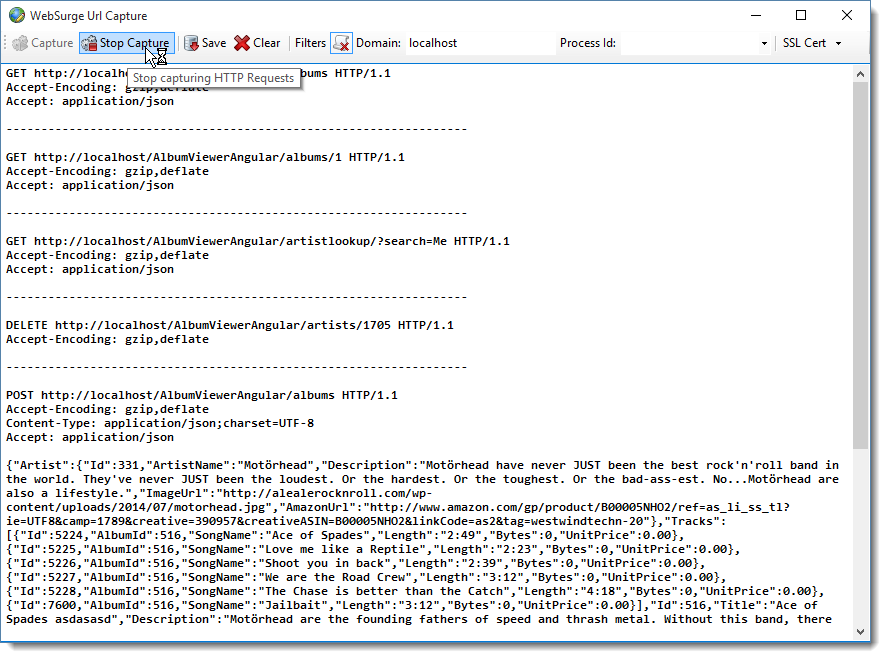
With this tool you can capture any HTTP content including SSL requests and content from HTML pages, AJAX calls, JSON APIs, SOAP or REST services – again anything HTTP that uses Windows or .NET HTTP APIs. Requests are captured as raw text. You can edit the HTTP trace text in the editor here, or after you've saved it to file because the format is one and the same. WebSurge uses this format as input for its tests.
Notice that capture window also has a few options for filtering requests that are captured which is useful to avoid capturing a bunch of noise that you typically don't want to test. If you're using Chrome for driving a Web Application you might see a bunch of Chrome's navigation pre-fetching URLs. For HTML sites you might capture google analytics and social links that you are probably not interested in for a stress test. You can specify the domain that you want to capture URLs from which excludes content from all other domains. You can also filter out static file links for images, css and js files which also may not be of interest in your testing. Personally I like to set up tests to only hit the actual data links of an application, so this makes it easy to capture only the things that I'm interested in with minimal cleanup after the capture is complete.
Use it for single URL Testing
Although WebSurge's primary purpose was for Load testing, I've found it to be a great tool for individual URL testing. I use it for API testing when I create my APIs initially and to ensure my APIs are working the way they are intended. Because you can capture a single or many URLs and store them on disk, this also provides a nice HTTP playground where you can record URLs with their headers, and fire them one at a time or as a session and see results immediately. And because you can save the sessions you have created, you can restore them later for repeating the tests or for sharing the tests with others also working on your project. I like to store sessions in source control so the traces are easily shared and also serve as a simple way to demonstrate API behavior that can be easily tested by new users.
Overriding Cookies and Domains
Speaking of sharing Sessions – when running tests on multiple machines or different domains, you often run into issues with cookies, domains, authorization and query string values changing. Using the Session Options you can override these values for your specific environment.
For example, in order to change the domain of all test requests that were run on localhost to dev.west-wind.com I can simply add the ReplaceDomain value. Now when a URL is accessed the orignal domain is replaced with the new value. You can use a domain name or domain plus virtual. Likewise if you have an authorization cookie in your captured content, that cookie may have expired and is no longer valid. You can use your browser to log on to your application and capture a valid cookie (using your favorite dev tools) and then replace either the cookie or an authorization header (for oAuth bearer tokens perhaps). Several people also requested ways to inject a query string value into requests.
![headeroverrides[6] headeroverrides[6]](http://weblog.west-wind.com/images/2015Windows-Live-Writer/a0a71be73c61_8667/headeroverrides%5B6%5D_thumb.png)
There are a number of options here that allow you customize each request sent or how the entire test is managed.
Running Load Tests
Once you’ve created a Session you can specify the length of the test in seconds, and specify the number of simultaneous threads to run each session on. Sessions run through each of the URLs in the session sequentially by default. One option in the options list above is that you can also randomize the URLs so each thread runs requests in a different order. This avoids bunching up URLs initially when tests start as all threads run the same requests simultaneously which can sometimes skew the results of the first few minutes of a test.
While sessions run some progress information is displayed:
![LoadTest[5]_thumb[2] LoadTest[5]_thumb[2]](http://weblog.west-wind.com/images/2015Windows-Live-Writer/a0a71be73c61_8667/LoadTest%5B5%5D_thumb%5B2%5D_thumb.png)
By default there’s a live view of requests displayed in a Console-like window. On the bottom of the window there’s a running total summary that displays where you’re at in the test, how many requests have been processed and what the requests per second count is currently for all requests.
Note that for tests that run tens of thousands of requests a second it’s a good idea to turn off the console display as the overhead of updating the screen starts affecting the performance of the test. There's a NoProgressEvent option in the Session options or your can use the button next to the thread count on the toolbar to disable the console display. The summary display continues to run however.
The summary display gives a running total of the test, and once an error occurs turns red.
Test Results
When the test is done you get a simple results display that lets you see what's happened at a glance:
![ResultDisplay_thumb[2] ResultDisplay_thumb[2]](http://weblog.west-wind.com/images/2015Windows-Live-Writer/a0a71be73c61_8667/ResultDisplay_thumb%5B2%5D_thumb.png)
On the right you get an overall summary as well as breakdown by each URL in the session. Both success and failures are highlighted so it’s easy to see what’s breaking in your load test. You can right click to open the the report in your default Web browser and save or print the HTML document from there.
The list on the left shows you a partial list of the URLs that were fired so you can look in detail at the request and response data. The list can be filtered by success and failure requests. Each item in the list can be clicked to see the full request and response data. Here's the view for a failed API request:
![RequestView_thumb[2] RequestView_thumb[2]](http://weblog.west-wind.com/images/2015Windows-Live-Writer/a0a71be73c61_8667/RequestView_thumb%5B2%5D_thumb.png)
This particularly useful for errors so you can quickly see and copy what request data was used and in the case of a GET request you can also just click the link to quickly jump to the page. For non-GET requests you can find the URL in the Session list, and use the context menu to Test the URL as configured including any HTTP content data to send.
You get to see the full HTTP request and response as well as a link in the Request header to go visit the actual page which is useful for GET requests where you can see the error occurring in your browser. If the content data is in a format that WebSurge can syntax highlight (JSON, XML, HTML,CSS) the content will be displayed in highlighted format. In the sample above the result is JSON, and the formatted version is displayed. You can click on the Raw Format button to see the original raw response which doesn't include the pretty formatting.
You can also export the actual test result detail and the result summary to either XML, JSON or the WebSurge plain HTTP Trace format:
![ExportResults_thumb[3] ExportResults_thumb[3]](http://weblog.west-wind.com/images/2015Windows-Live-Writer/a0a71be73c61_8667/ExportResults_thumb%5B3%5D_thumb.png)
The result summary is output as JSON and is a nice way to keep a historical record of your tests. The summary basically exports what you see on the summary screen with the test summary for the overall test, and a summary for each of the URLs in the test. These exports can get very large if you ran long or very high volume tests…
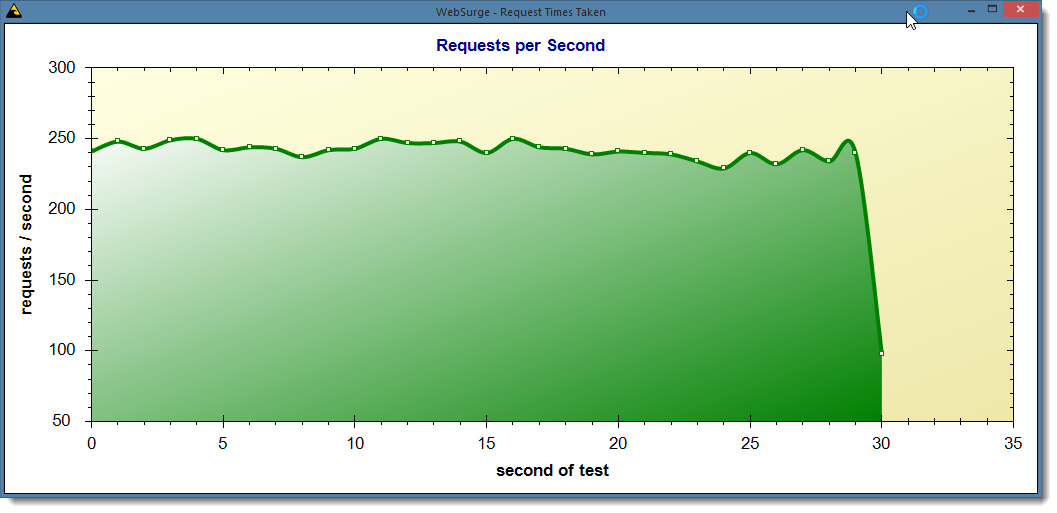
Finally you can also get a few charts. The most useful one is probably the Request per Second chart which can be accessed from the Charts menu or shortcut. Here’s what it looks like:
Plug-in Support
WebSurge also has support for plug-ins with a very simple interface that allow you to hook into the request processing pipeline. The .NET based plug-in interface allows you to look at each plug-in before and after a request fires. This allows you the ability to create data driven tests where you can use your code to inject dynamic data into requests. You can look at requests after they complete and create custom logging schemes if you choose. There are also two additional events that give you a reference to the request list when the test starts and the full list of requests after tests have completed.
Here's a very simple example that modifies the content of the request by injecting a random user ID into the request content on every POST request and logging each request into a custom text file. To use this code you'd create a new project and add a reference WebSurge.Core then implement the small IWebSurgeExtensibility interface (there's also a WebSurgeExtensibilityBase class you can override):
public class ModifyContentPlugIn : IWebSurgeExtensibility
{

    public bool OnBeforeRequestSent(HttpRequestData data)
    {
        var header = new HttpRequestHeader
        {
            Name = "x-request-time",
            Value = DateTime.UtcNow.ToString("o")
        };
        data.Headers.Add(header);


        if (!string.IsNullOrEmpty(data.RequestContent))
        {
            // do something here to get your unique value
            var userId = new Random().Next().ToString();

            // then embed it into the content
            data.RequestContent = data.RequestContent.Replace("##UserId##", "USER_" + userId);
        }

        return true;
    }

    public void OnAfterRequestSent(HttpRequestData data)
    {
        LogString(data.StatusCode + " " + data.HttpVerb + " " + data.Url + " " + data.TimeTakenMs);
    }

    public void OnLoadTestCompleted(IList<HttpRequestData> results, int timeTakenForTestMs)
    {
        LogString("*** Test Run completed. (" + (timeTakenForTestMs/1000).ToString("n0") + "secs)" );
    }

    public bool OnLoadTestStarted(IList<HttpRequestData> requests)
    {
        LogString("*** Test Run started.");
        return true;
    }


    static object syncLock = new object();

    private void LogString(string message)
    {
        lock (syncLock)
        {
            StreamWriter streamWriter = new StreamWriter(Environment.CurrentDirectory + "\\requestlog.txt", true);
            streamWriter.WriteLine(DateTime.Now.ToString() + " - " + message);
            streamWriter.Close();
        }
    }
}
Note that requests are served in a highly concurrent environment so any code you create here has to be thread safe. For example the code above locks the file handle access to ensure that file access is synchronized between executing sessions.
You can compile this code and drop it into a plug-ins subfolder below the application's install folder and the plug-in will kick in.
I've heard a lot of feedback of the last year on people wanting to automate their tests and data drive them. I'm not sure I see a good way to make this generic, but if you have some specific use cases you want to explore I'd love to hear about it and see if something more generic can be hooked up. In the meantime the plug-in mechanism provides a custom work around.
You can find out more, on documentation Wiki.
Command Line Interface
WebSurge runs with a small core load engine and this engine is plugged into the front end application I’ve shown so far. There’s also a command line interface available to run WebSurge from the Windows command prompt. Using the command line you can run tests for either an individual URL or you can reference an existing session file.
Here's what the output from an indvidual url test looks like:
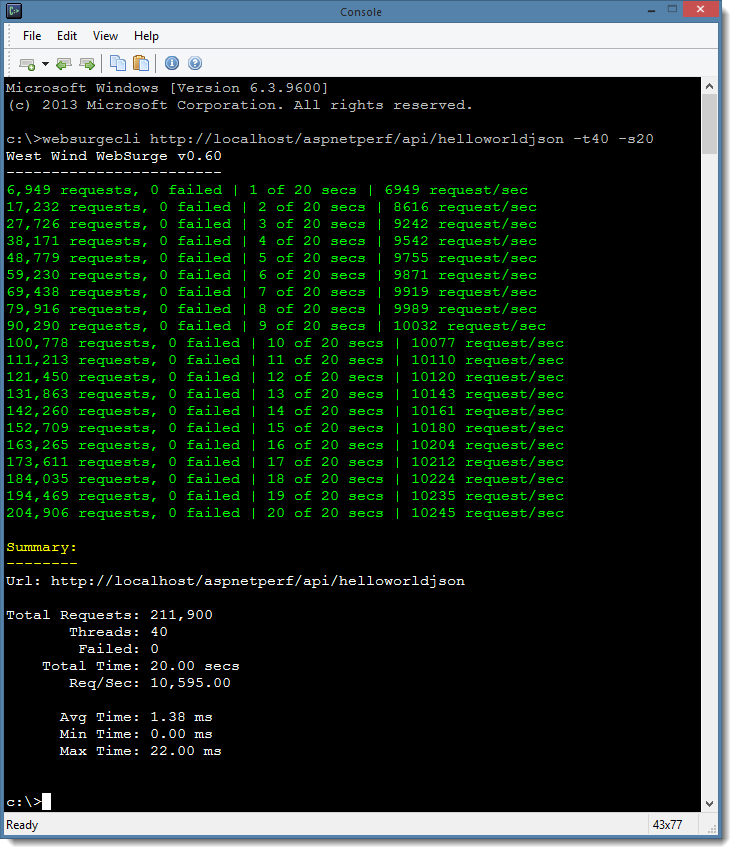
By default when it runs WebSurgeCli shows progress every second showing total request count, failures and the requests per second for the entire test. A silent option can turn off this progress display and display only the results.
Here are all the command line options available:
West Wind WebSurge v1.0
------------------------
usage:   WebSurgeCli <SessionFile|Url> -sXX -tXX -dXX -r -yX

Parameters:
-----------
SessionFile     Filename to a WebSurge/Fiddler HTTP session file
Url             Single URL to to hit

Commands:
---------
-h | -?      This help display

Value Options:
--------------
-s          Number of seconds to run the test (10)
-t          Number of simultaneous threads to run (2)
-d          Delay in milliseconds after each request
               1-n  Milliseconds of delay between requests
               0   No delay, but give up cpu time slice
               -1   No delay, no time slice (very high cpu usage)
-y          Display mode for progress (1)
               0 - No progress, 1 - no request detail,
               2 - no progress summary, 3 - show all

Switches:
---------
-r          Randomize order of requests in Session file

Output:
-------
--json       Return results as JSON

Examples:
---------
WebSurgeCli http://localhost/testpage/  -s20 -t8
WebSurgeCli c:\temp\LoadTest.txt  -s20 -t8
WebSurgeCli c:\temp\LoadTest.txt  -s20 -t8 --json
The command line interface can be useful for build integrations that allow checking for failures perhaps, or hitting a specific requests per second count etc.
Version 1.0
I announced WebSurge about a year ago, and it's been a fun journey since. There've been a few challenges in using the .NET HTTP client for this and in the future I might have to switch something a bit more high performance capable. There's also been a lot of great feedback and suggestions that have since been integrated into the tool. Source code is now available on GitHub and the licensing has been adjusted so the tool is free for personal or open source use. Only commercial use requires a reasonably priced paid-for license.
There's lots more that I'd like to add to WebSurge in the future, but in the meantime I think it's time to push an actual non-beta release version out and since the product has been in stable mode for the last couple of months and a half now seems a good time to make that release push. If you haven't tried it, I hope you give it a try, and if you have used it previously give it another look as lots of new features and perf improvements have been added since the early betas.
Get Involved
I’m definitely interested in feedback. If you run into issues or have suggestions for features or want to get involved, you can use GitHub Issues for the WebSurge project. For more general discussions or specific use case questions you can also post a message on the West Wind Message Board in the WebSurge secton.
Microsoft MVPs and Insiders get a free License
If you’re a Microsoft MVP or a Microsoft Insider you can get a full NFR license for free. Send me a link to your current, official Microsoft profile and I’ll send you a not-for resale license. Send any messages to sales@west-wind.com.
Resources
For more info on WebSurge and to download it, use the following links.