

JavaScript Debugging in a Web Browser Control with Visual Studio
Visual Studio 2019 Update
In Visual Studio 2019 Microsoft has removed the JavaScript Console from the product, so while you can still step through the code, look at the call stack and view variables, you can no longer view
console.log()output, nor dynamically execute code or view console variables. You can continue to use these features in VS2017 and for this reason I keep my VS2017 installation alive.If this feature is important to you please submit feedback in Visual Studio via the Feedback → Feature Request option and let Microsoft know you'd like this feature back in VS2019 and beyond.
Debugging an embedded Web Browser control in a Windows application can be a pain. The Web Browser control is essentially an embedded instance of the Internet Explorer engine, but it lacks any of the support (F12) tooling for debugging.
A few months ago I posted a about using Firebug Lite to provide at least Console output to your JavaScript/HTML based logic. This basically provides an integrated console - based on inline JavaScript - with full support for console logging output including deep object tree access for variables. If all you need is to access a few simple values to check state or other informational settings, this is certainly a quick and easy to go.
Visual Studio Studio HTML Debugging
But if you need to debug more complex code, using Console based output can only get you so far. A few days ago I had introduced a regression bug into the spell checking code in Markdown Monster and man was it tricky to debug. Console debugging had me running in circles.
Right around the same time I got a comment on the Firebug Debugging post that casually mentioned that you can use Script debugging in an EXE application by externally attaching a debugger to the EXE and then choosing Script Debugger. A bit of experimenting ensued...
I vaguely knew that Visual Studio can debug Internet Explorer code, but didn't put the pieces together to see how to do this with my own applications like Markdown Monster that are running an embedded Web Browser control. It didn't occur to me because standalone Windows projects like a WPF app don't offer script debugging as part of the debugging UI.
There are two ways to do this:
Attach Debugger
You can start up Visual Studio and attach a debugger to an already running application that hosts the Web Browser control and specify you want to debug Script code. This works, but it's a bit tedious because you need to explicitly attach the debugger to a running process to do it. But since you are attaching to a process, it works with any kind of EXE application not just .NET applications, and it works even if you can't change and set breakpoints in the script code.
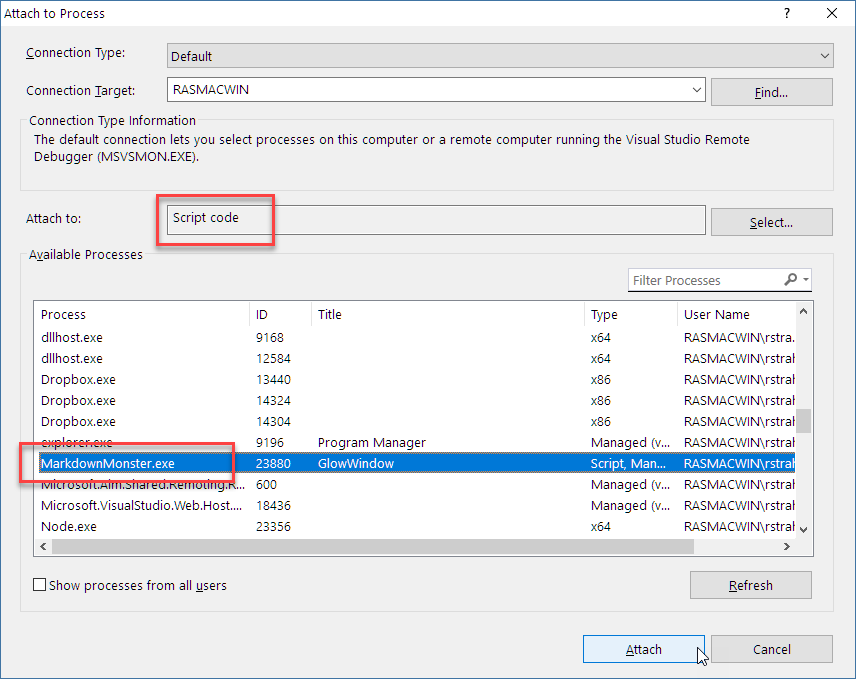
To set this up:
- Start up your application from Explorer or Command Line
- In Visual Studio use Tools->Attach to Process
- Attach the Debugger to Script Code
- Pick your EXE from the Process list
Here's what the Attach Dialog should look like:
Break on Error Internet Explorer Options
The Web Browser control is essentially embedded Internet Explorer so Internet Explorer's options determine Web Browser behavior as well. One of the options available allows you enable script debugging. Actually it's more like disable the disable script debugging default option 😃.
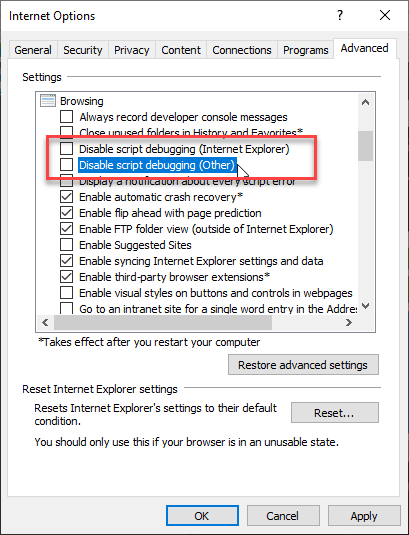
To do this:
- Open Internet Explorer
- Go to Settings
- Go to the Advanced Tab
- Set both Disable script debugging to unchecked
Once enabled you can set debugger breakpoints in your script code and force a dialog that lets you choose the debugger you want to use.
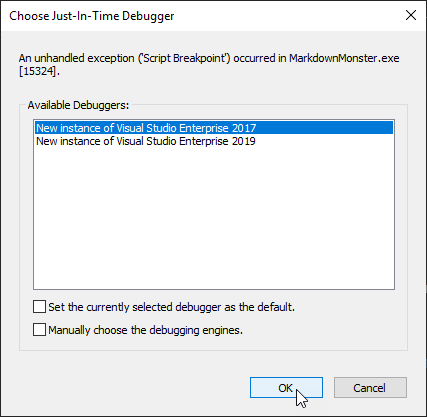
and that should plant you right at your breakpoint in Visual Studio.
Script Debugging Dialog pops on All Errors
Note that when script debugging is enabled like this, any error in the JavaScript code will trigger this dialog.

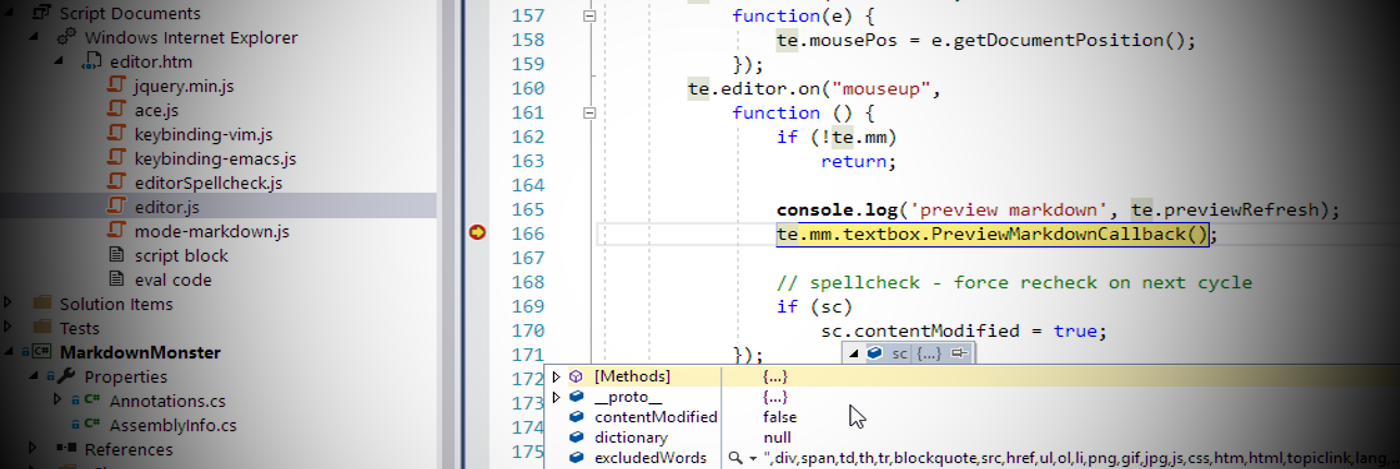
Inside of Visual Studio
Once the debugger is attached, Visual Studio automatically tracks any scripts that are running in a Script Documents section in the Solution Explorer and you can open the document from there.
Markdown Monster uses HTML for the Markdown editor and also the preview so both of these pages and their scripts show up in the Script Documents section immediately.
Now to debug code:
- Open the script file from Script Documents (not from your project!)
- Set a breakpoint anywhere
- Run your code to the breakpoint
- Examine variables by hovering
- Fix broken sheiit
- Go on with your bad self!
To open the JavaScript Console and DOM Explorer:
- Type JavaScript Console into Quick Launch
- Type DOM Explorer into Quick Launch
Here's what all of this (minus the DOM Explorer) looks like in Visual Studio:
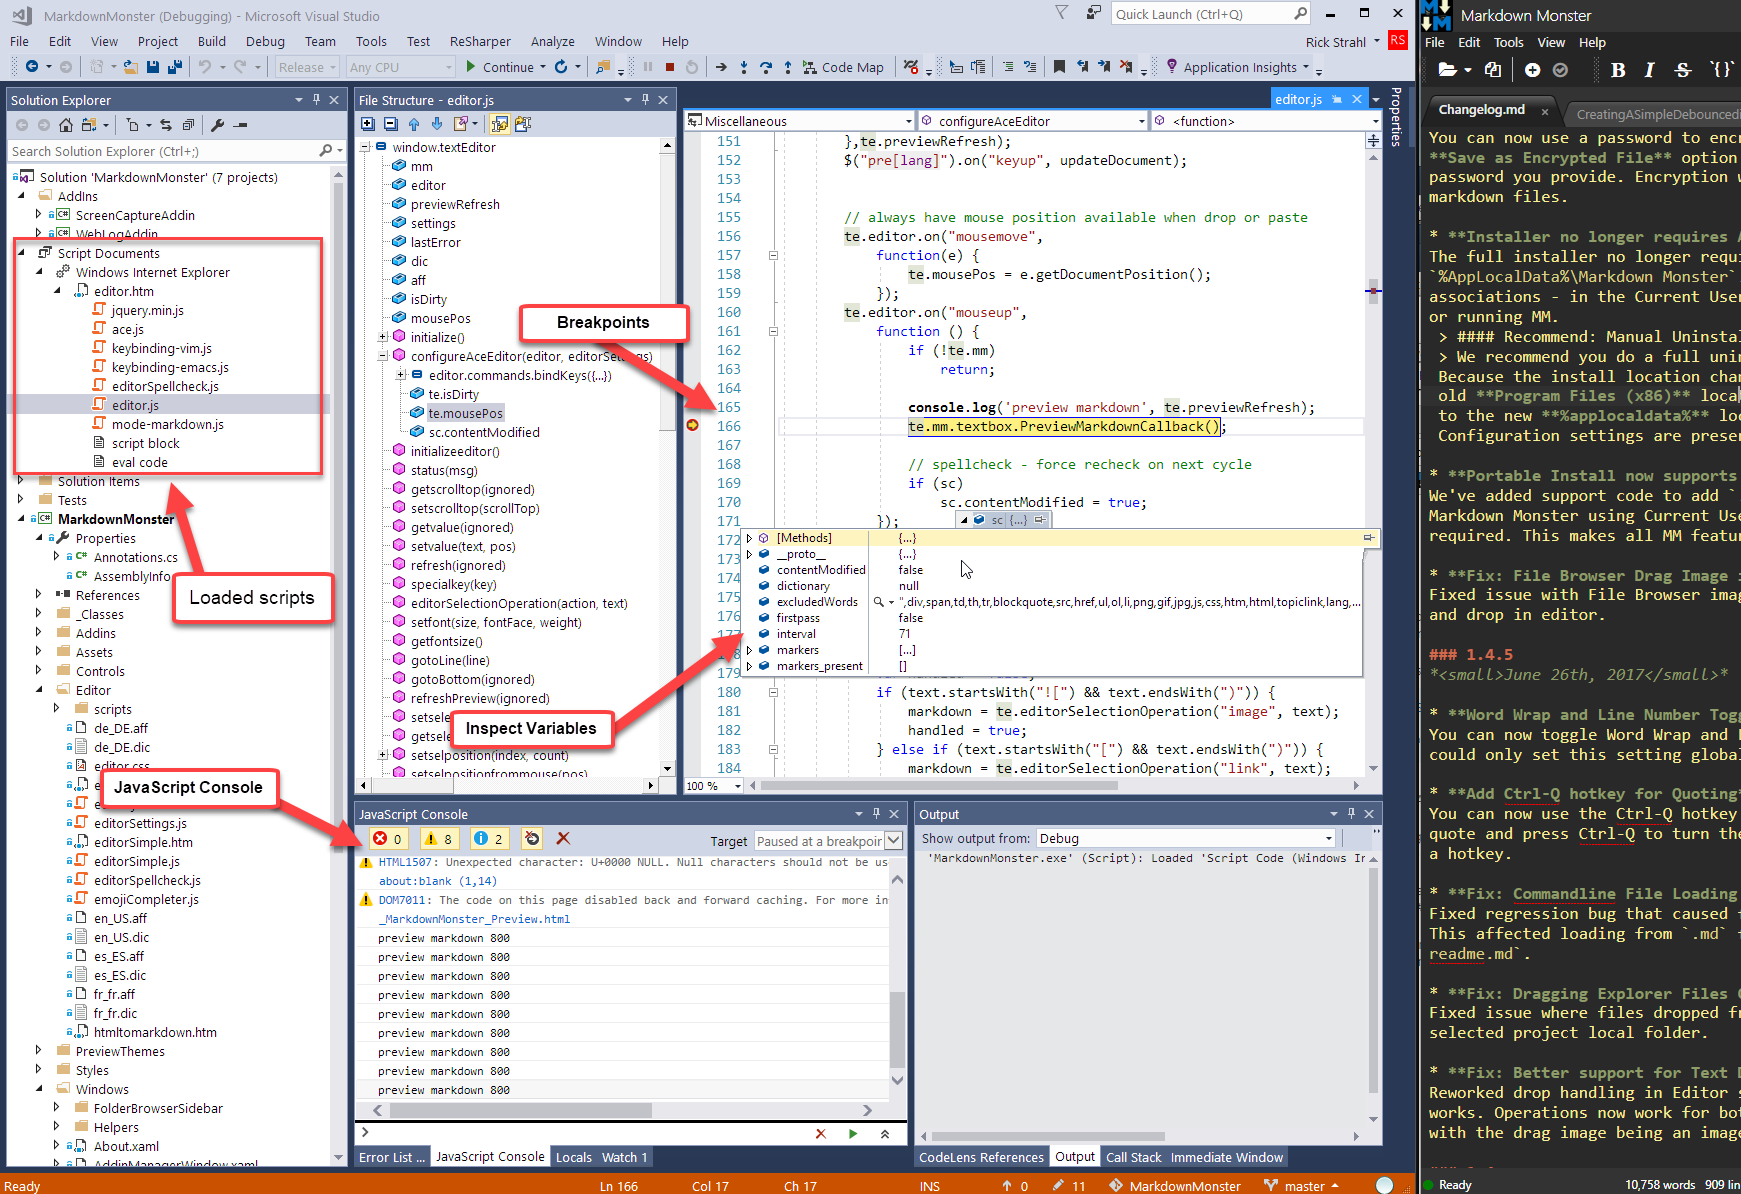
Once you have a breakpoint set you can examine variables and drill into objects just like you'd expect to do in Visual Studio.
You can also open the JavaScript Console which gives you interactive access to the document and script code running in it - just as you would with the regular F12 tools in Internet Explorer. There's also a DOM Explorer that lets you drill into any open document's DOM tree and CSS. These two features use the same F12 tools that you use in full Internet Explorer, just planted into Visual Studio. Usually this wouldn't be so exciting since the F12 tools work fine in IE, but since the Web Browser Control doesn't have a shell and hence no F12 tools support, this fills a big glaring hole in Web Browser Control development.
Watch where you make Code Changes!
If you look at my screen shot you can see that the script file debugged is open and I can edit this file and make changes - if I reload the page (or open a new document in Markdown Monster for example) the change shows up in the executing code.
But be aware that the path to the script file will be in the application's deployment folder, not the file that might live in your project.
In Markdown Monster the Editor and Preview JavaScript code is part of my .NET project as content files that are copied to the output folder when the project builds.
When you debug with the Visual Studio debugger, the files in Script Documents are the actual files running, which are in the deployment folder (ie. \bin\Release). So if you make changes to a script file, make sure you copy those changes back to your project folders after you're done debugging or else the changes are simply overwritten the next time you compile your project.
You've been warned! 😃
I say this because I've done this more than a few times in the past - debugged my files made some changes, then recompiled the .NET project and: Faaaark!, I just overwrote my changes. Don't let that happen to you.
Debug This!
Having full debugging support for the Web Browser Control in my own Windows applications is going to make my life a lot easier. I've made do with Console output based debugging for a long time and while it's a huge step up from no debug support at all it can be tedious. Using the full debugger is a huge leg up when dealing with more complex code in JavaScript.
After I hooked up the debugger in Visual Studio I found my Spellcheck issue in Markdown Monster in a matter of a couple of minutes after previously spending well over an hour with trying to find the right console.log() calls to try and trace down the bug.
Attach to Process is a bit tedious but it works with any executable - it doesn't have to be a .NET application like my WPF Markdown Monster app. I have an ancient FoxPro application that also use the Web Browser control and I can debug the HTML/JavaScript code the same way in Visual Studio. Heck even an old MFC application Web Browser would be debuggable this way.
Internet Explorer Options setup is probably a better way if you control the script code you are debugging as you can just enable it and set breakpoints with debugger statements to get into Visual Studio to debug. I find myself using this approach now primarily, after I forgot how to get that enabled in the IE options (thanks to Ian's comment).
What would be even nicer if Visual Studio allowed you to debug Script code as part of running a .NET application, but that option sadly is not available so one of the other approaches is needed to get into Visual Studio's script debugger.
Awesome! Thanks to @Donnchadha for pointing me in the right direction.
 this post created with
Markdown Monster
this post created with
Markdown Monster
Other Posts you might also like
The Voices of Reason
# re: JavaScript Debugging in a Web Browser Control with Visual Studio
I have a WinForms app which uses a WebBrowser control which loads an html file using file:\ which loads a third party html editor. I don't see "Script Documents" in Solution Explorer during debugging. Won't this show only for web projects? Isn't MarkdownMonster a WPF app which is like Winforms (both are desktop apps) so come it's showing for you?
# re: JavaScript Debugging in a Web Browser Control with Visual Studio
I've had the same trouble in the past trying to debug embedded script in a .NET application. You can actually make it even easier to debug embedded script by creating a C++ "Empty Project" in Visual Studio. You can then have the project set to run an external application, like the build output from another project in your solution, and set the C++ project to debug Script directly. Finally, set the C++ project as your Startup project.
It takes a couple minutes to set up, but at the end, you can just F5 your solution, set a breakpoint in your script, and watch it break right where you want it to. Of course, the downside to this approach is that you have to have the Visual C++ components installed.
# re: JavaScript Debugging in a Web Browser Control with Visual Studio
Before script debugging will work, you may need to go into the Internet Explorer options and turn off "Script Debugging" in the Advanced tab.
# re: JavaScript Debugging in a Web Browser Control with Visual Studio
Hmmm... works for me without that. I think Visual Studio sets that somehow, although it might require running under Admin to get that to work.
# re: JavaScript Debugging in a Web Browser Control with Visual Studio
I prefer to use Codelobster for JavaScript debugging
# re: JavaScript Debugging in a Web Browser Control with Visual Studio
This article just saved me. Good looking out Rick!
# re: JavaScript Debugging in a Web Browser Control with Visual Studio
There is another IE flag in the options above that also help, it covered by bottom of red box and defaulted off. You can 'enable' the option to be 'notified of every script error' ( lots of popups). Tells you file/line#/errormsg. By default you can't jump into the debugger, unless attached, but this will popop with hints and correct line #'s. So helpful.
# re: JavaScript Debugging in a Web Browser Control with Visual Studio
@Johnx - yup, but that dialog is very noisy and whether the debugger pops up depends on configuration and security settings - it's very unreliable and annoying if you forget to turn it off. Best not to muck with that one I think.
# re: JavaScript Debugging in a Web Browser Control with Visual Studio
I remember debugging JavaScript in the WebBrowser control being a right pain. The way I got Visual Studio to debug it was slightly different than what you outlined above:
WebBrowsercontrol if it was running).debuggerstatement to your JavaScript codeWhen it hits the
debuggerstatement it should pop up the dialog that asks if you want debug using the current instance of Visual Studio, etc.