The .NET PerformanceCounter class generally is pretty easy to use in order to retrieve performance information. You create a perf counter, initialize the first value to read, let some time pass and then read the next value and Windows gives you access to a plethora of performance information. It’s nice what’s available to make that happen.
Process Specific Performance Counters
On several occasions, however, I’ve had a need to profile Process specific performance counters. For example, I need to look at a specific running application and display its CPU usage similar to the way Process Manager does. At first glance that seems easy enough as you can simply request a PerformanceCounter for a process by its name.
Here’s the simple code to do this (I’m using Chrome as my instance I’m profiling here):
var perfCounter = new PerformanceCounter("Process", "% Processor Time", "chrome");

// Initialize to start capturing
perfCounter.NextValue();

for (int i = 0; i < 20; i++)
{
    // give some time to accumulate data
    Thread.Sleep(1000);

    float cpu = perfCounter.NextValue()/Environment.ProcessorCount;

    Console.WriteLine("Chrome CPU: " + cpu);
}
This works and gets me the active CPU status for Chrome.
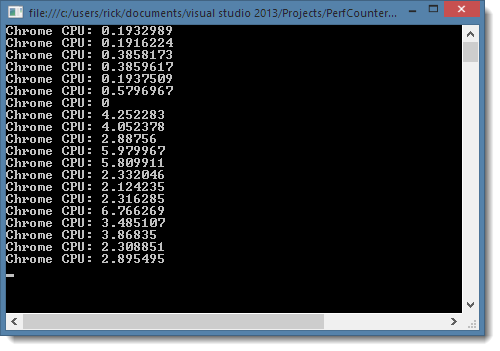
When I run the above code, I get output that looks something like this:

PerfCounters work by specifying Category (Process) and a key (% Processor Time) to create a counter. Once you have a counter instance you need to ‘start’ it collecting data, which you can do by calling NextSample() or NextValue(). This sets the counter to collecting data until the next call to NextValue() is fired at which time a value can be retrieved and provide an average for the time period measured. Typically you need to allow for a good chunk of time between the initial collection and the value collection so you get a reasonable sample period for Windows to collect the perf data. Here I’m using Thread.Sleep() but in an application you can possibly have the perf counter running on a background thread.
I’m collecting CPU data, which is provided as a percentage value. Note that the data is spread out over all the cores of the machine. This is why once I get the value I have to divide by Environment.ProcessorCount to get a value that resembles what’s displayed in task manager. This doesn’t quite make sense to me as single threaded code typically doesn’t spread across all cores, but it seems to be the same behavior that task manager and process explorer use. It’s also the guidance that Microsoft provides themselves.
The code above looks like it works fine collecting data and looking at task. But do you see a problem with this code especially in light of profiling Chrome which uses multiple process with the same name?
Eenie meenie miney mo – which Process has to go?
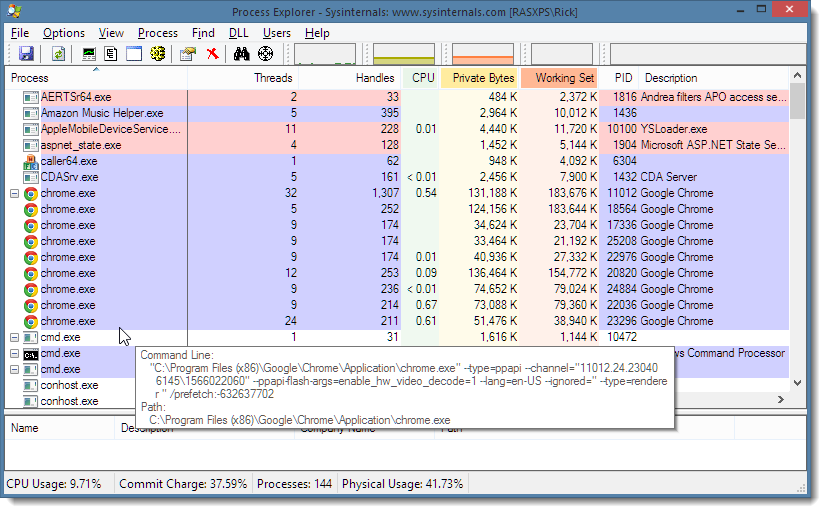
I used Chrome as my profiling target and the problem is that there are more than one instance of Chrome running. Check out task manager -even though I only have a single browser instance open, each tab inside of the browser runs as its own executable. In Process Explorer there are many instances of Chrome running and I have really no idea which one I was specifically monitoring.

The PerformanceCounter API has an annoying limitation – you can specify only a process name! It would be much more useful if you could actually specify a process ID rather than a process name, but well, that would be too easy.
Getting a Process Specific Performance Counter
It turns out there are a few workarounds for this. Essentially there’s a special performance counter API that lets you enumerate all processes and another that gives you an ‘Instance Name’. Specifically there’s the PerformanceCounterCategory class which allows you to retrieve a full list of ‘instance’ names for running processes. This list has unique IDs for each process and if there are multiple processes they are referenced like this:
chrome
chrome#1
chrome#2
chrome#3
and so on.
You can iterate over this list and match the Process ID from the PerfCounter returned and based on that get the InstanceName. You can then use these unique names to pass to the PerformanceCounter Process instance instead of the Process Name to get at a specific process for profiling information. And yeah, the code to do this is kind of ugly and can be also be very slow depending on how you handle it.
When I ran into this initially I found a number of Stackoverflow references as well as a post that shows a partial solution. But all of them were either incorrect (missing instances) or very slow (iterating over all objects) or require an explict process name – none of which worked for what I need this functionality for.
I’m working on a monitoring application that specifically monitors a group of processes and needs to display all of their CPU load characteristics in addition to other process data like memory and uptime.
It took a while of tweaking to get the code correct to include all instances, and to perform adequately. Specifically the instance lookup and looping through instances to find the process ID can be excruciatingly slow especially if you don’t filter the list of process names.
In the end I created a small reusable class that provides a more performant version:
public class ProcessCpuCounter
{
    public static PerformanceCounter GetPerfCounterForProcessId(int processId, string processCounterName = "% Processor Time")
    {
        string instance = GetInstanceNameForProcessId(processId);
        if (string.IsNullOrEmpty(instance))
            return null;

        return new PerformanceCounter("Process", processCounterName, instance);
    }

    public static string GetInstanceNameForProcessId(int processId)
    {
        var process = Process.GetProcessById(processId);
        string processName = Path.GetFileNameWithoutExtension(process.ProcessName);

        PerformanceCounterCategory cat = new PerformanceCounterCategory("Process");
        string[] instances = cat.GetInstanceNames()
            .Where(inst => inst.StartsWith(processName))
            .ToArray();

        foreach (string instance in instances)
        {
            using (PerformanceCounter cnt = new PerformanceCounter("Process",
                "ID Process", instance, true))
            {
                int val = (int)cnt.RawValue;
                if (val == processId)
                {
                    return instance;
                }
            }
        }
        return null;
    }
}
There are two static methods here, with the GetPerfCounterForProcessId() being the high level one that returns you a full perf counter instance. The useful stuff relevant to this discussion however is the GetInstanceNameForProcessId() which receives only a Process Id and then spits back a normalized instance name – ie. Chrome, Chrome#1, Chrome#2 etc.
The slight optimization that results in significant performance improvements over the other samples is the filter for the process name so that new perf counter instances are only created for matching process names, not against all processes. On my machine I have 180 processes running and the process access was excruciatingly slow. By filtering down to only hit those names that match performance drastically improved. Note also that I’m not passing in a process name, but rather do a Process lookup using the Process class to get the name. Process returns the full file name but the Process Perf API expects just the file stem, so the extension is stripped by the code.
Trying it out
To check out this class I can now create a small test program that shows me the CPU load of all Chrome instances running:
// grab all Chrome process instances
var processes = Process.GetProcessesByName("chrome");

for (int i = 0; i < 10; i++)
{
    foreach (var p in processes)
    {
        var counter = ProcessCpuCounter.GetPerfCounterForProcessId(p.Id);

        // start capturing
        counter.NextValue();

        Thread.Sleep(200);

        var cpu = counter.NextValue()/(float) Environment.ProcessorCount;
        Console.WriteLine(counter.InstanceName + " -  Cpu: " + cpu );
    }

}

Console.WriteLine("Any key to exit...");
Console.Read();
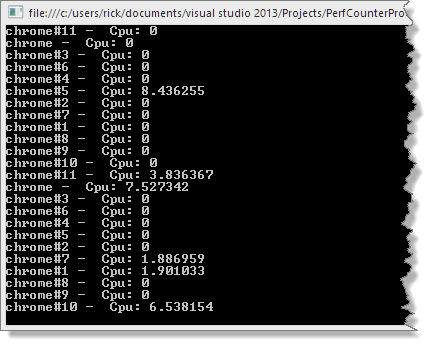
The code basically runs in a dumb loop for 10 times and on each pass it goes through all the chrome instances and collects the perf data for each instance displaying the instance name (Chrome, Chrome#1, Chrome#2 etc.) and the current CPU usage.
Here’s what it looks like:

Performance is decent – there’s still a good deal of overhead on start up for the first time. As the Performance Counter API initializes apparently there’s a bit of overhead. But after the initial delay, performance is pretty swift.
Workey, Workey
I was able to plug this code into my process monitoring Web application that needed to display server status for a number of application servers running on the backend. I’m basically monitoring the worker processes for an admin summary page as well as for notifications if the CPU load goes into the 80%+ range. It works well.
This is another kind of obscure topic, but when you need to do per process monitoring I hope this article will come in handy to some of you…
Other Posts you might also like