So it looks like Chrome 39 Canary has this issue fixed. Let’s hope when v39 release lands it’s still be working…
Since the last few Chrome releases have come out (v38 as of this writing), I’ve had some major issues with debugging not working properly. The behavior I see is pretty strange but it’s repeatable across different installations, so I thought I’d describe it here and then link it to a bug report.
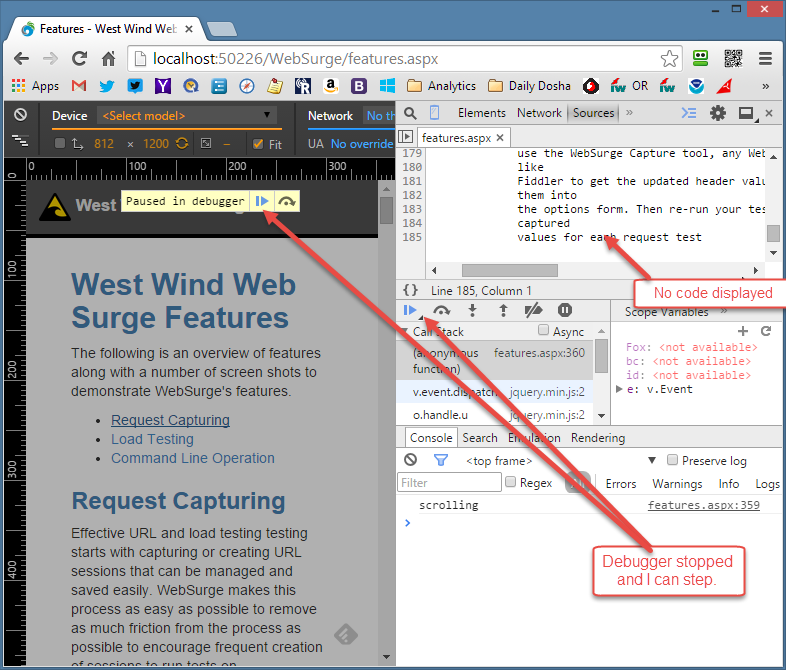
What’s happening is that I have had many instances where the debugger is stopping on a breakpoint or debugger; statement, but is not actually showing the source code. I can see the debugger is stopping because the black screen pops up and I can see the play button in the debugger window.
What’s odd is that it works and the debugger stops the first time after I start the browser. If I reload the page a second or third time though, the debugger still stops, but doesn’t show the source line or even the right source file.
This is not an isolated instance either. I initially started seeing this issue with an Angular application, where the debugger would exhibit this same behavior in some situations, but not in others. Specifically it appeared the debugger worked in straight ‘page load’ type code – it stops and shows source code properly. But when setting a breakpoint inside of event code – an ng-click operation for example – the debugger again would stop, but not show the source code.
Example
So here’s a simple example from http://west-wind.com/websurge/features.aspx. I kept the script inline for keeping it simple, but whether the script is embedded or external really makes no difference to the behavior I see.
The page has a small bit of copied script in it that scrolls the page when you click one of the in page anchor links that navigate to hash tags that exist in the page. The code works now, but I initially had to make a few changes to make it work on my page from the original source. Inside of jquery click handler I have the following code:
$("a[href*=#]:not([href=#])").on("click", function (e) {
   console.log('scrolling');
   debugger;
   …
Now when I do this on my local machine I get the following in Chrome 38:

In this example, because it’s all one page the page at least is loaded, but when I had problems with my Angular app, the right source file wasn’t even opened.
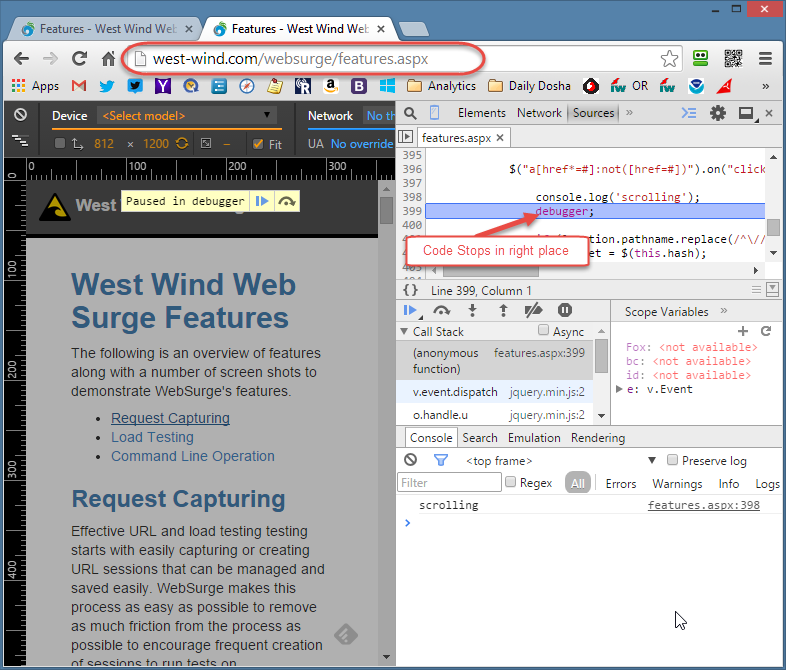
Now if I hit the same exact page (just uploaded) on my live site I get the proper debugger functionality – but only on the first load. Reloading the page again after a restart I see the same behavior I see on localhost.
First load looks like this (correct behavior):

But then subsequent requests fail again…
What I’ve Tried
My initial thought has been that there’s something wrong with my local Chrome installation, so I completely uninstalled Chrome, and Canary, rebooted and the reinstalled Chrome from scratch. But I got no relief from that exercise. I was hopeful that Chrome 38 which landed today (and replaced the generally messy 37 release) might help but unfortunately the problem persists.
I also disabled all plug-ins but given that my version on a remote machine worked with all plug-ins running makes me think it’s not the plug-ins.
Still thinking it might be something machine specific I fired up one of my dev VMs and tried checking out the code in there – and guess what same behavior. So it doesn’t look like this is a configuration issue in Chrome but some deeper bug with the source parsing engine.
I had also thought that with the Angular app earlier the problem might have been some issue with script parsing or map files, but even using non-minified scripts I ended up with the same issue.
I also experimented with the breakpoint options in the browser’s source tab which lets you disable breakpoints from stopping. This had no effect, since it doesn’t appear this option affects debugger statements, only actual breakpoints set in the debugger itself.
Finally I tried the nuclear option: I ran the Chrome Software Removal Tool to completely nuke and reset my settings. It removes plug-ins, clears history and cookies, resets config: settings and otherwise completely resets Chrome. Other than plug-ins I don’t really have much in the way of customizations, so I didn’t think this would really help and sure enough it didn’t – the errant behavior continues.
Update: Looks like Chrome 40 has fixed this behavior
I noticed that when installing a Canary update yesterday, started to show the problem going away. In Canary Version 40+ breakpoints are doing the right thing and showing source code!
Nasty Bug
This is an insidious bug – and it’s been plaguing me for a few weeks now. In this page this isn’t exactly a big deal but in a recent larger AngularJs app I was working on I constantly ran into this problem and it was bad enough I ended up switching to FireFox for all debugging purposes. FireFox and Firebug work fine (as do the IE DevTools) but I generally prefer running in Chrome because overall the tools are just a little easier to work with in my daily workflow, so I’d like to get to the bottom of this issue.
So my question is – has anybody else run into this weird problem where some pages are not debugging? Any ideas on what to else to try? I did submit an issue to Google – lets see if anything comes of that.
Other Posts you might also like